- You are here:
-
Home

-
Companies & Campaigns
- Kneebone: Key Performance Algorithm - Understanding the Cause, Effect and Result of Marketing
- Category: September 2012 - Performance Marketing
 Kneebone Inc., a cross-marketing performance technology company, is determined that there is a strong need for marketers to have an easy way to visualize marketing performance - at any level - whether it be product, segment, marketing vehicle, etc. In addition, marketers should not require the support of statisticians to build complex models over days, weeks, or months.
Kneebone’s Key Performance Algorithm (KPA) addresses exactly this challenge by automatically learning historical performance at any level and providing a visual context to this historical performance over time. It answers the question: “What should my performance (revenue, clicks, leads, applications etc.) be, given this marketing investment or combination of investments?
In the following we want to provide our readers with an overview of the Kneebone concept. So if you‘re looking for ways to depict the performance of your marketing efforts just read on or watch the video.
Key Performance Algorithm (KPA)
To make performance visible at any level, from any single marketing activity up to a grand view of an entire year of campaigns, the algorithm relies on two key components: the Planning Event and Performance Baselines. The Kneebone white paper begins with a discussion of events and shows how baselines can be built for them.
The curves produced by the Kneebone cross-marketing performance technology are not statistically derived but use a patented mathematical set of algorithms:
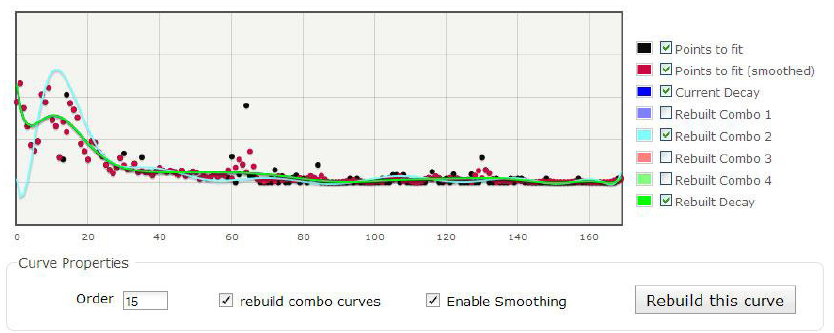
Decay Curves: A decay curve governs how a vehicle behaves after an instance of it has been launched.
Weekly Curves: The weekly curve is a set of normalized ratios that determine how the vehicle behaves during each of the seven days of the week as defined for a client. Since a decay curve is virtualized to be independent of an actual date, superimposing a weekly behavior on a vehicles nature is essential.
Annual Curves: Annual curves superimpose on decay and weekly curves to describe how a vehicle behaves when used at different times of the year. A number of tools are available for modeling such seasonal behavior. Seasonally adjusted performance rates, and a sophisticated blend of Fiscal Period adjusted decay curves (called combo-curves) are deployable options for the model.
Base Lining Using Curves: For an actual instance of a vehicle, the curves are used to build a baseline of behavior which can be tracked against actual behavior.
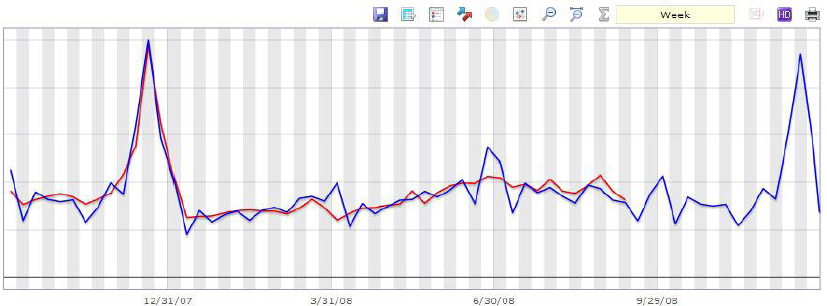
This is a multi-year view of a sequence of Attributed Residual events’ actual versus base lined performance. The daily baseline points have been aggregated to weekly bins in the above view.
The KPA algorithm models real campaigns and marketing activities in which there may be thousands of events but each of them has this granular baseline model. It allows performance to be visualized at any aggregated level but one can always drill down to an individual event’s performance on a single day if needed.
Kneebone’s Key Performance Algorithm versus Statistical – Econometric Models
The performance modeling in Kneebone is not statistical. It does not sample the available data in any way but, rather, uses the entire available (and validated) history. The baselines produced are not considered to be a statistically accurate answer to a question. Rather, they represent a forward looking benchmark for performance based on modeling great historical baselines.
The Key Performance Algorithm represents a range of possible performance which, like every other data set within Kneebone, makes itself available for further query, including, if desired, statistical analysis. If a Kneebone baseline is based upon historical performance than deviations between actual and base lined performance represent opportunities for learning. There will always be deviations, as the nature of marketing and non-linear human behavior ensures this. Kneebone is designed to make variance highly visible inspiring a lay-marketing analyst to ask meaningful questions. Hence, data aggregation, visualization and cross-marketing Key Performance Algorithms are not the answer; they are just the starting points for questions.
A comprehensive statistical or econometric model is a substitute for luck at the granular level - where executional decisions count. But understanding these conditions from a global point of view, and certainly on a customized basis per customer, can be very useful for helping out with one’s educated guesses at where deviation may come from and for crafting global options for future marketing plans, market mix modeling and budgeting decisions.
By MediaBUZZ
