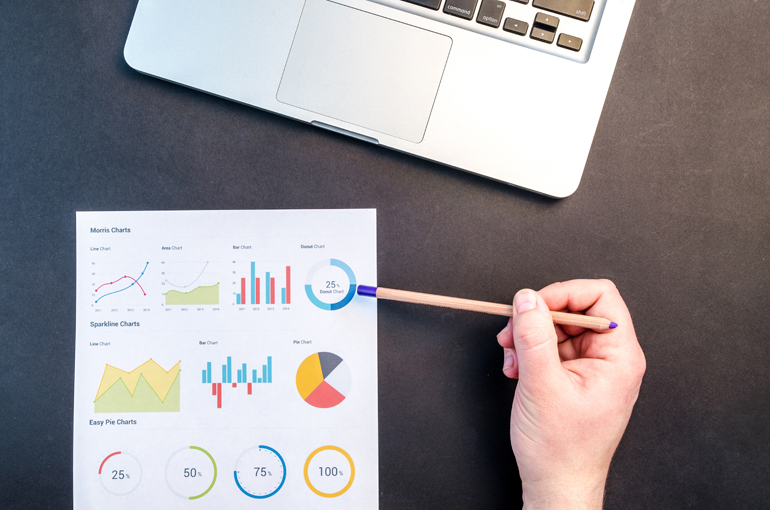
 Imagine how blind we were before the data. The question now for brand managers is what to do with all the new knowledge. Big data in marketing circles often refers to the enormous amounts of data that businesses collect from marketing campaigns, customers, and business leads collated through different channels.
However, when it comes to Southeast Asia, the picture is not the same. Marketers face a dearth of consumer insights due to our shorter history of digital advertising and fewer digital touch points, compared to Western markets. As a result, brands find it harder to observe and pick up fast-changing consumer habits in this region.
Driving Data and Digital OOH
Driven by big data, out-of-home (OOH) advertising is experiencing a renaissance globally, especially with digital out-of-home (DOOH) due to its versatility as a digital touch point. Formerly seen as the “last broadcast medium” targeting people on the move, DOOH’s capability is its ability to not only to reach – but actually target – the young, urban population that might otherwise be difficult to achieve through traditional media.
The numbers speak for themselves. Out-of-Home advertising is now a US$29 billion market with revenue expected to grow by 3 to 4 per cent per year over the next five years to reach US$33 billion by 2021, according to the MAGNA Intelligence and Rapport study. Although digital OOH contributes only 5 per cent of the global OOH inventory, it already generates 14 per cent of total advertising revenues and is expected to grow to 24 per cent globally by 2021. The exposure weekly to DOOH per capita has significantly increased from 8 minutes in 2008 to 20 minutes in 2017.
Connecting screens in Southeast Asia with IDOOH
A key player in the in-vehicle DOOH space is Asian OOH media technology company IDOOH. Our mission is to make rides better – across our inventory of over 24,000 screens across cars, taxis, vehicular roadsides and rail stations in Asia Pacific. With a diverse range of content from entertainment, news, trailers, and relevant commercials, the in-vehicle screens attract commuters to engage one-on-one in a captive environment for at least 20 minutes.
Behind the screen is IDOOH’s big data architecture to ‘capture all’- from location, time, taxi details, previous location prior to engagement and campaign attributes. We also capture location and movement of the fleet which provides data on historical and real-time which can be used in the data analytics.
At the core of our data collection is connectivity – not just from one device to one platform but multi-device-multi-platform connectivity. With mobile thrown into the mix, brands can use device proximity or location-specific activations to integrate both in-vehicle screens and mobile devices and engage consumers in transit, when they are more likely to be active on a screen.
Such a sophisticated use of data is driving the senior management decision-making process.
Gartner predicted that 30 per cent of enterprise access to big data would be through intermediary data broker services, to support business decisions. To support client’s data needs, IDOOH’s partner ecosystem of fleet owners, ride-sharing companies, content providers and brands benefit from the all-encompassing data collection, where all data points are captured consistently. They are subsequently used for data modelling to extract valuable information in the future for a variety of users across different industries.
Driving the future - From data to analytics
Beyond data collection, IDOOH is positioned to help brands with information for predictive purposes. One such means is the utilization of metadata to find analysis-worthy big data needed in order to introduce new products and services that might also be of interest. For instance, this could be to decipher passenger viewership content and engagement to derive insights into consumer preferences and behaviors.
There are also plans to further develop IDOOH’s big data architecture with descriptive, predictive and prescriptive analytics.
We currently support our clients in the area of Descriptive analytics - data processing, mining and visualization. The goal is to develop the online interactive data visualization platform further and provide customers with the tools so that they can manipulate and extract useful business knowledge and insights aligned to their business goals.
The next phase of predictive analytics is where we use machine learning to build models to predict outcomes to a level of certainty. For example, based on a set of multi-variates when a customer engages on a particular advertisement, such as a new bar at about 9 pm Saturday night, travelling in a specific direction from a certain location, the data predicts that they are going out to town for a night out.
Building on predictive analytics capability, we prescribe a campaign’s roll-out through a push-pull model – in that, we can drive, push or sequence the most relevant content to the customer, based on real-time information. For instance, based on the above example, we could promote a new nightclub event with a discount coupon in exchange for contact details to support lead generation and track sales conversions.
Through all three types of data analytics, we can help drive the business agenda by arming marketers with insightful data and feedback in real-time. Conversely, consumers also benefit from more relevant and engaging content delivered to them. Consumer habits and behaviors are constantly changing in an ever-evolving digital economy. The only way to detect that shift is to trust the data.
By Mark Capogreco and Malcolm Wong, IDOOH


